//@version=4
//DepthHouse Trading Indicators
// by oh92
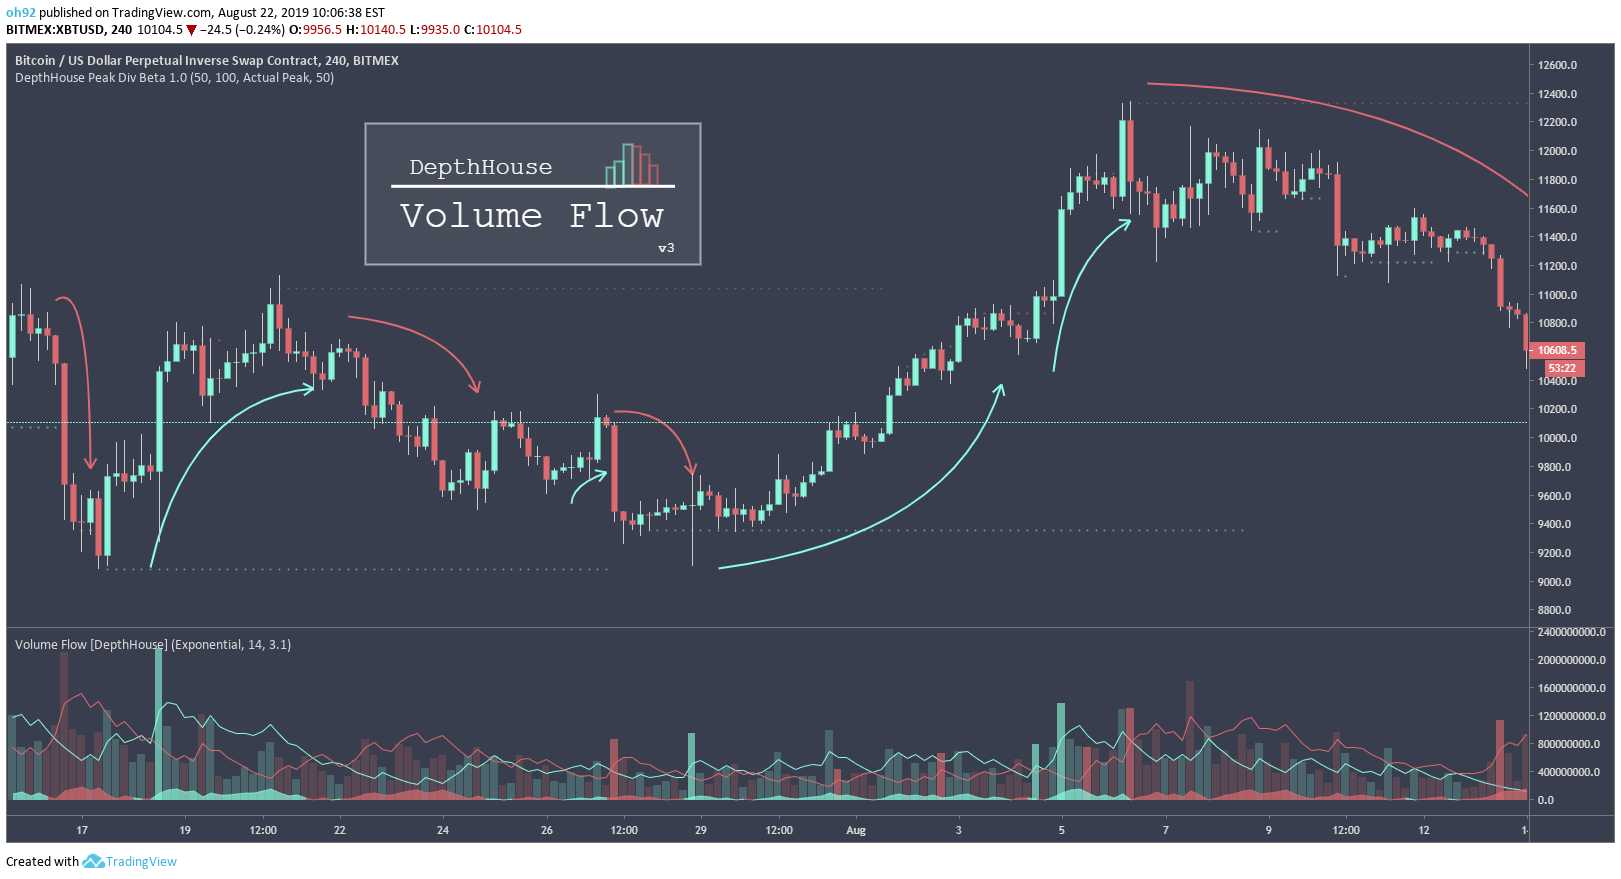
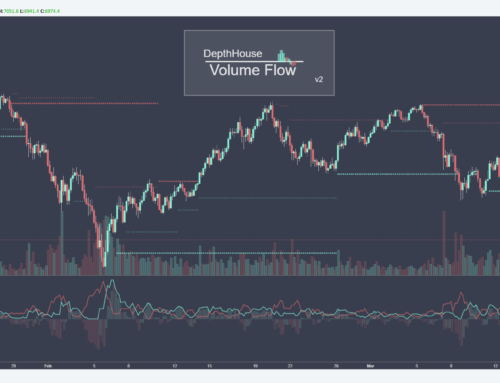
study(“Volume Flow v3″, shorttitle=”Volume Flow [DepthHouse]”)
maType = input(title=”Moving Average Type”, options=[“Simple”, “Exponential”, “Double Exponential”], defval=”Simple”)
length = input(14, title=”MA Length”)
x = input(3.1, title=”Factor For Breakout Candle”)
//////////////////////////
// oh92 favorite colors //
//////////////////////////
red = #FF510D //#ff848a // #FA8072 // #323433 // #ff848a
green = #5AA650 // #8cffe5 // #6DC066 // #80aebd // #8cffe5
// Basic Volume Calcs //
vol = volume
bull = close>open?vol:0
bear = open>close?vol:0
// Double EMA Function //
dema(src, len) => (2 * ema(src, len) – ema(ema(src, len), len))
// BEAR Moving Average Calculation
bullma = maType == “Exponential” ? ema(bull, length) :
maType == “Double Exponential” ? dema(bull, length) :
sma(bull, length)
// BEAR Moving Average Calculation //
bearma = maType == “Exponential” ? ema(bear, length) :
maType == “Double Exponential” ? dema(bear, length) :
sma(bear, length)
// ma dif //
vf_dif = bullma-bearma
vf_absolute = vf_dif > 0 ? vf_dif : vf_dif * (-1)
// Volume Spikes //
gsig=crossover(bull, bullma*x)?vol:na
rsig=crossover(bear, bearma*x)?vol:na
// Color Calcs //
vdClr = vf_dif > 0 ? green : red
vClr=close>open?green:red
// Plots //
plot(vol, color=vClr, style=plot.style_columns, transp=80, title=”Volume”)
plot(bullma*2, color=green, linewidth=1, transp=0, title=”Bull MA”)
plot(bearma*2, color=red, linewidth=1, transp=0, title=”Bear MA”)
plot(gsig, style=plot.style_columns, transp=50, color=green, title=”Bull Vol Spike”)
plot(rsig, style=plot.style_columns, transp=50, color=red, title=”Bear Vol Spike”)
plot(vf_absolute/2.5, style=plot.style_area, color=vdClr, title=”Difference Value”)