//@version=2
//by oh92 [DepthHouse Indicators]
//Version 2 is used because V3 causes lag in gap display – would love to update this at a future date
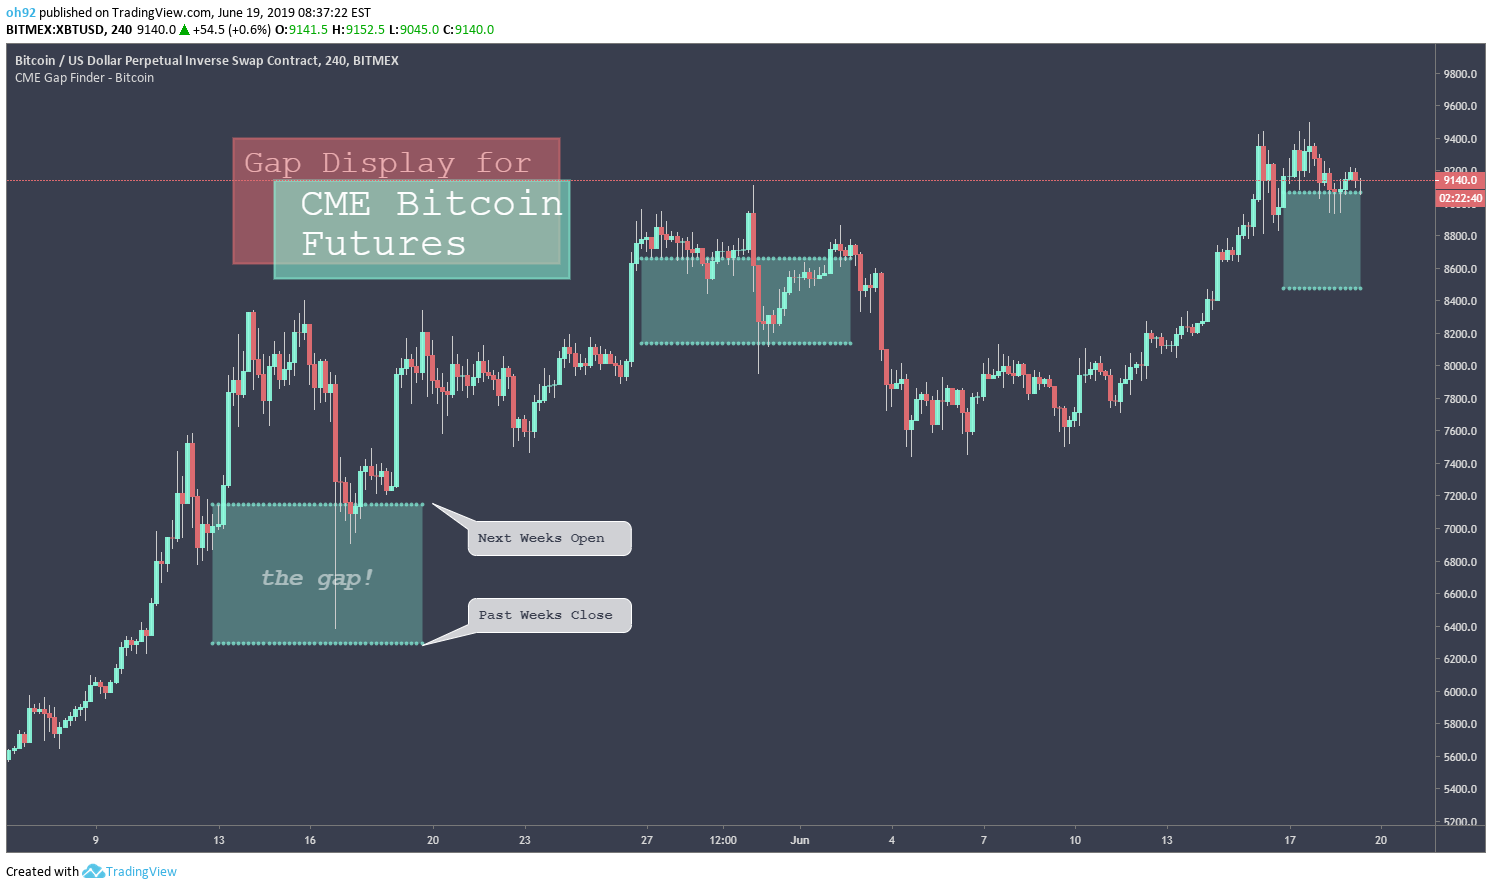
//Weekly Gap Display for the Bitcoin CME Futures market
study(title=”CME Gap Finder – Bitcoin”, overlay=true)
//Criteria using Weekly Sessions
cwo = security(‘CME:BTC1!’, ‘W’, open)
pwc = security(‘CME:BTC1!’, ‘W’, close[1])
pwh = security(‘CME:BTC1!’, ‘W’, high[1])
pwl = security(‘CME:BTC1!’, ‘W’, low[1])
gap_up = cwo > pwh ? 1 : 0
gap_up_open = gap_up == 1 ? cwo : na
gap_up_close = gap_up == 1 ? pwc : na
gap_down = cwo < pwl ? 1 : 0
gap_down_open = gap_down == 1 ? cwo : na
gap_down_close = gap_down == 1 ? pwc : na
////OH92’s FAVORITE COLORS////
g = #8cffe5
r = #ff848a
gg = #adff75
rr = #ff80be
p1 = plot(gap_up_open, title=”Gap Up – Weekly Open”, style=circles, linewidth=2, color=g)
p2 = plot(gap_up_close, title=”Gap Up – Last Weeks Close”, style=circles, linewidth=2, color=g)
fill(p1, p2, color=g, transp=70, title=”Gap Up Fill”)
p3 = plot(gap_down_open, title=”Gap Down – Weekly Open”, style=circles, linewidth=2, color=r)
p4 = plot(gap_down_close, title=”Gap Down – Last Weeks Close”, style=circles, linewidth=2, color=r)
fill(p3, p4, color=rr, transp=85, title=”Gap Down Fill”)