For the next 30 days people enjoy the DepthHouse Peak Momentum Indicator for FREE!
To participate you can either comment on the original post on TradingView, message oh92 directly on TradingView, or simply request a Free Trial here on the DepthHouse site.
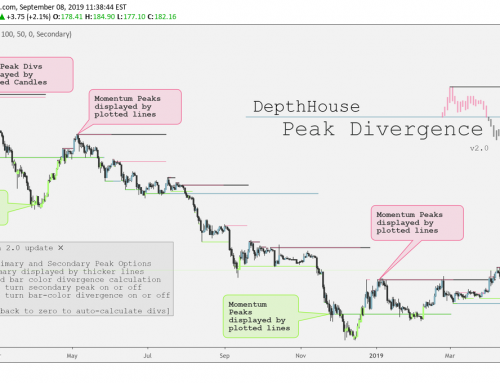
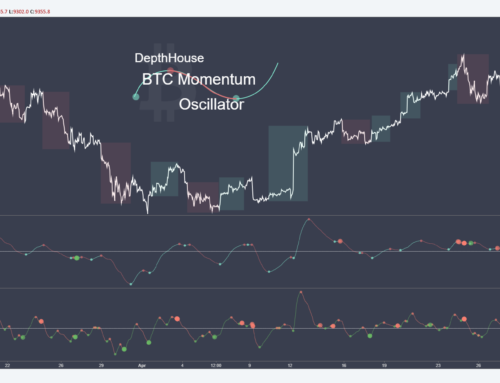
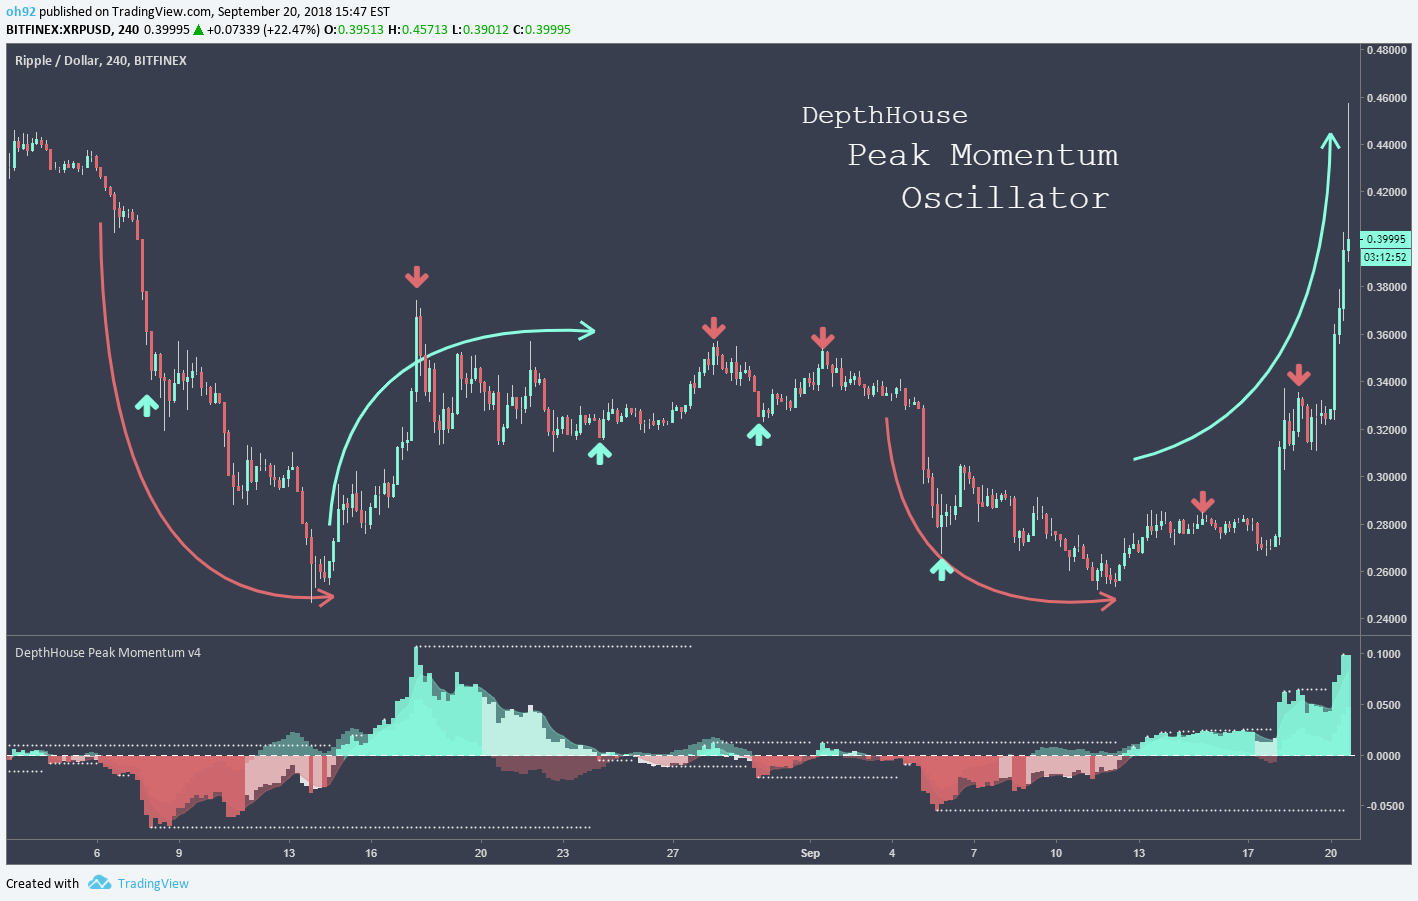
DepthHouse Peak Momentum Oscillator uses advance calculations of linear regression to help determine price momentum and momentum peaks.
How to read it:
The least opaque columns represent general momentum direction.
When these columns are above the zero line, generally there is more bullish momentum in the market.
When they are below the zero line, generally there is more bearish momentum in the market.
When these columns turn white, it means the price could be losing its bullish or bearish momentum.
The more transparent columns in the background represent the lead band, which reacts faster than the general momentum columns.
This could be used to as a leading indication of where the market could be heading.
Swap Momentum Bands option:
This option removes the white columns from the general momentum histogram and in turn only gives signals when strong momentum is present.
**Free BETA Expires Oct. 21 2018**