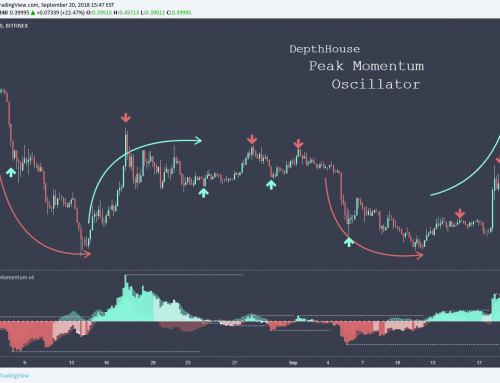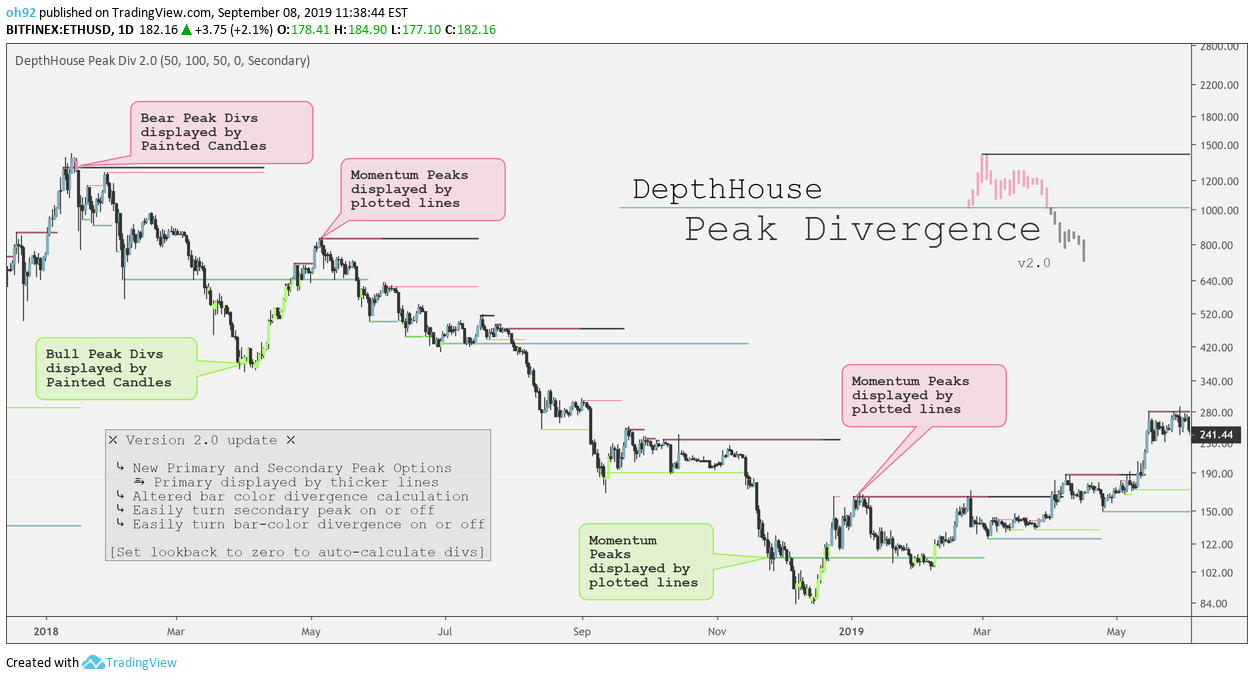
DepthHouse – Peak Divergence indicator uses the linear regression calculation to help determine and plot peak momentum points throughout financial markets.
Peak levels are then displayed by either red or green lines above or below the candle.
Red lines above the candles represent a peaks in bearish momentum while Green lines below represent peaks in bullish momentum. These levels are a great tool to help support intermittent tops and bottoms along with possible support and resistance.
The projected peak levels are then used to determine momentum divergence in the market.
IF momentum divergence is present the bars colors will change represent either bull or bear divergence.
Important Notes:
If the price crosses a peak line and the bar color does not change; it means momentum has increased/decreased with the price and the divergence has been canceled.
If divergence is present, and then the following candle is not colored then momentum has increased to cancel the previously present divergence.