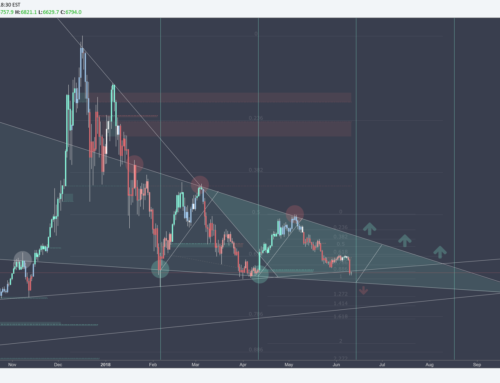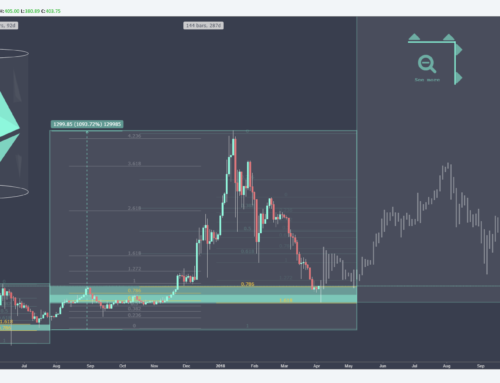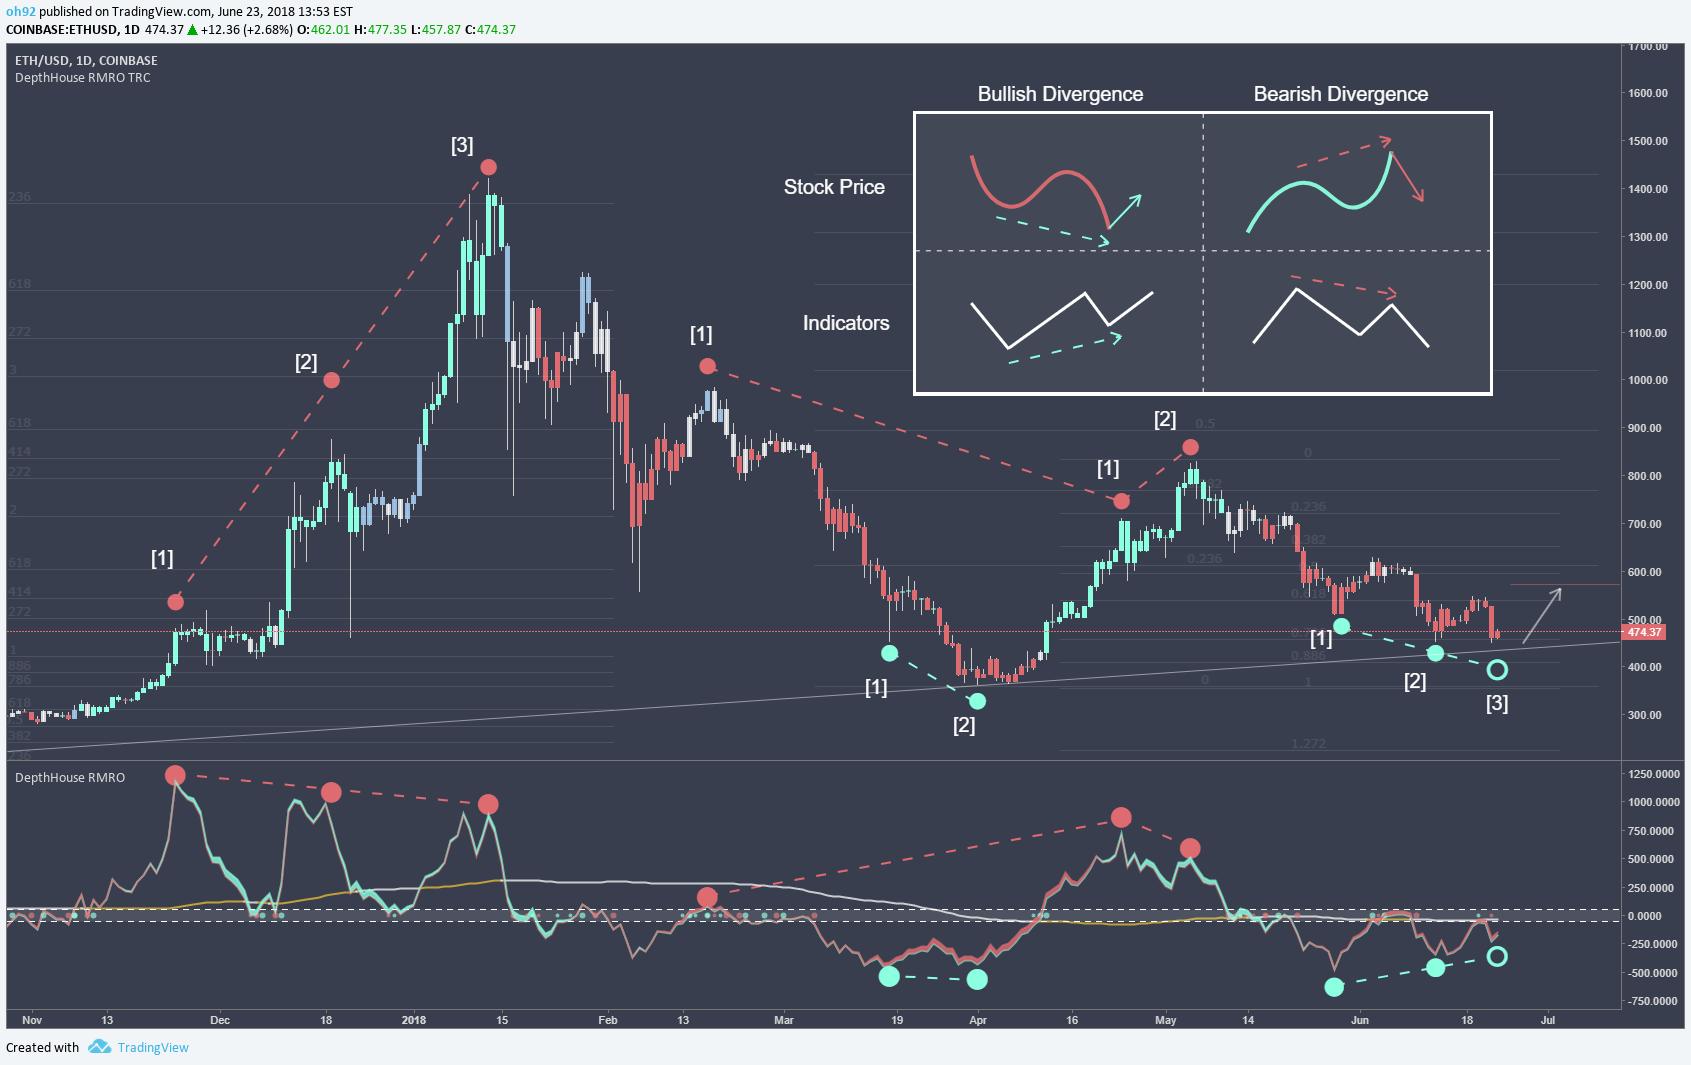
A quick study composed to illustrate the multiple levels of divergence Ethereum has had since November of last year.
Based on this study, short term trend changes typically took place at the second level of divergence on the Relative Momentum Range Indicator. The only other acceptation for this, was the reversal from the top this last January. At that time, was so much upward momentum in the market that it took until the third signal of divergence to confirm a trend change.
Some of you will say that this happens all the time, which is true. However this typically occurs on lower timeframes. Typically the higher the timeframe, the higher the chance of a divergence signal to lead into a confirmation.
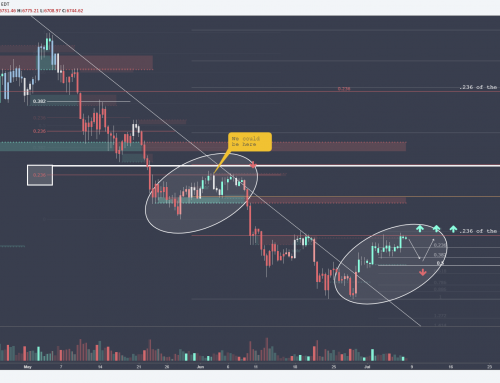
Looking at where we are now, we once again have a potential third attempt of bullish divergence forming on the daily chart .
By no means is this a signal to buy.. The crpyto market as a whole is going through an extremely bearish cycle at the moment.
However, looking closer at the chart you will see that we have potential trendline support around $420. I believe that if we hit this and the support holds, that the bullish divergence could give us some upward momentum.
Third Time’s a Charm – Divergence Study by oh92 on TradingView.com
DISCLAIMER:
Please note I am only providing my own trading information for your benefit and insight to my trading techniques, you should do your own due diligence and not take this information as a trade signal.