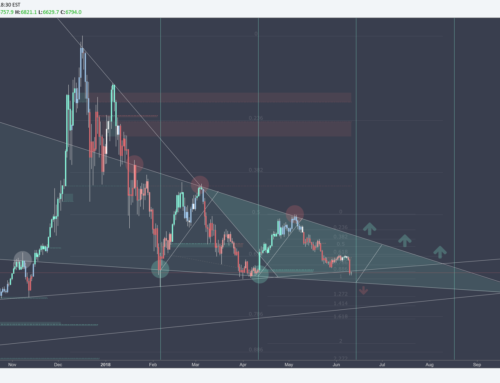
After a fantastic break of the daily trendline , Bitcoin has once again found itself at a .236 Fibonacci level. Which based on history, this level often marks the end of the road up for Bitcoin.
However, there are a couple other factors to consider which may shed a gleam of light on the situation.
Reasons why Bitcoin could continue up:
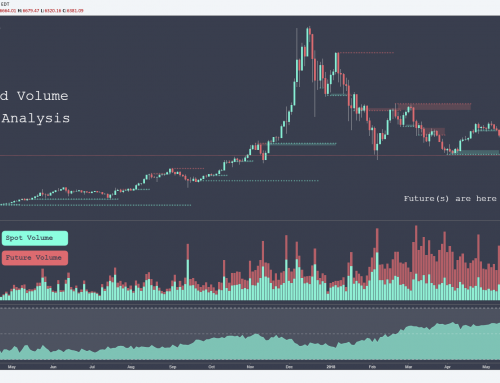
- Bitcoin had a fantastic break of the daily downward trendline . You will notice that the volume indicator showed a green candle during the breakout which confirmed an drastic volume increase. This is a very good factor to consider when differentiate a breakout from a fakeout.
- Bitcoin formed and confirmed a perfect double bottom on higher time frames. Which just happened to be on a major support level .
Reasons why Bitcoin could continue downward:
- Bitcoin has broken several downward trendlines in the past. All of which have resulted in a continuation downwards.
- Even though Bitcoin -0.13% had a volume spike at the breakout, overall volume in this market has plummeted which no signs of reversal yet.
- We are currently sitting at the .236 fib level of the current swing.
IF we fail to break the current .236 resistance, Bitcoin will likely continue down to form lower lows.
IF Bitcoin does break the .236 and forms a higher high, a larger upward correction may be possible.
IF this does then turn into a larger upward correction, the next key level to reach and break would be the .236 of the full swing.
This level sits just above 9k.
Click here to be redirected to the original post on TradingView
DISCLAIMER:
Please note I am only providing my own trading information for your benefit and insight to my trading techniques, you should do your own due diligence and not take this information as a trade signal.