After a week of nothing but sideways, Bitcoin finally made its big move. Unfortunate for many, it was not in the direction many had hoped for.
Shortly after seeing a negative volume spike Bitcoin plummeted, smashing through the so called meme line at ~$7000 creating nearly a -$1000 daily.
With the meme line broken many bulls are running for cover.
However with a little Trendline analysis, there is still hope for Bitcoin.
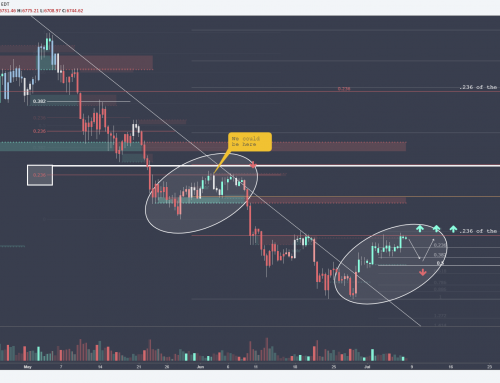
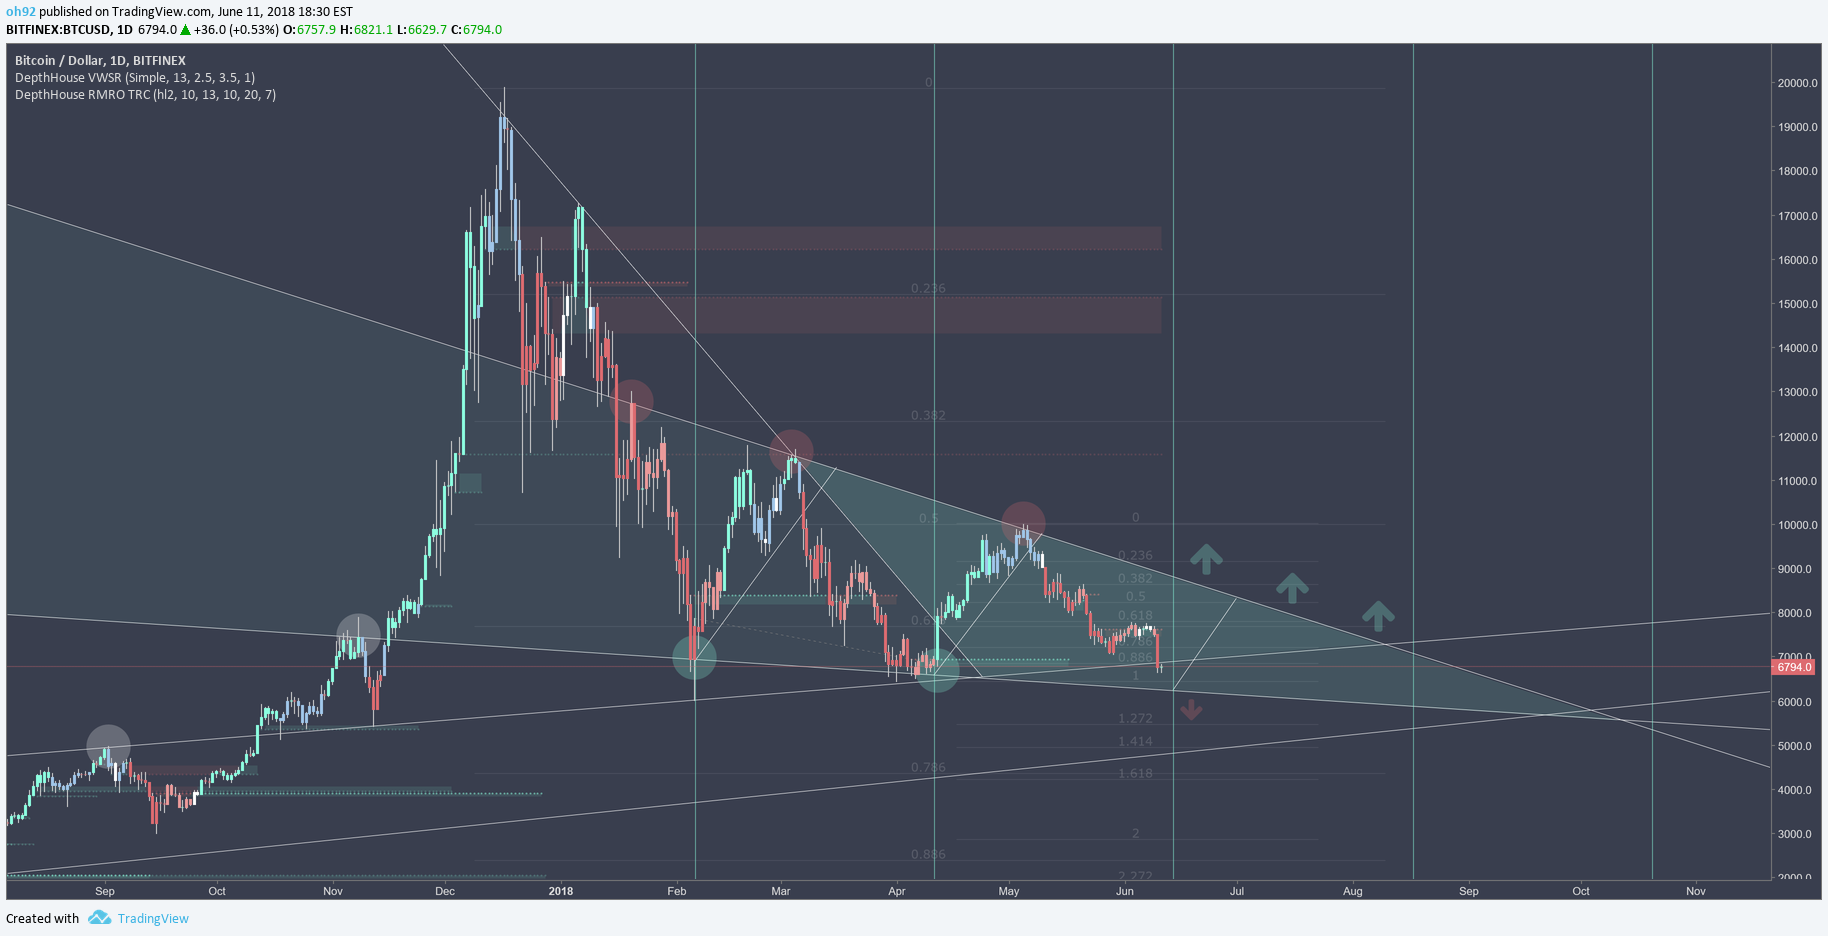
The chart above shows us sitting right below the recently broken meme line. Then just a few hundred dollars below is a possible wedge support line ~$6200.
IF we find support at $6200, it would confirm the falling wedge , which could turn into a reversal.
By taking this analysis a step further, I placed cyclic lines from the last two temporary bottoms. Based on these lines there could be a possible bounce within the next couple days. This is my first time experimenting with these so the results will be interesting either way.
Note: Cyclic Lines allow the user to set two vertical lines a specified distance apart.
Currently I am playing the small swings and waiting for a clear signal in either direction.
Unlike several of the posts I’ve came across, I do not believe the break in the meme line is the death of BTC 0.37% .
IF BTC fails to find support a the bottom of the wedge I will start to worry a little.
I hope many of you found this article hopeful, helpful and a little interesting!
I wish you all the best of luck!
DISCLAIMER:
Please note I am only providing my own trading information for your benefit and insight to my trading techniques, you should do your own due diligence and not take this information as a trade signal.
Article was taken from a post on TradingView: https://www.tradingview.com/chart/BTCUSD/tiJ7MKtM-Meme-Lines-and-Wedges/